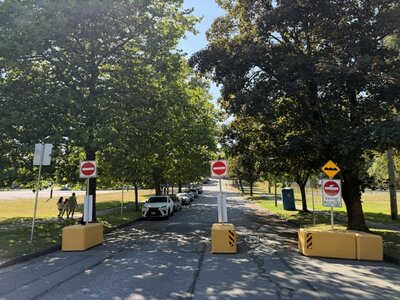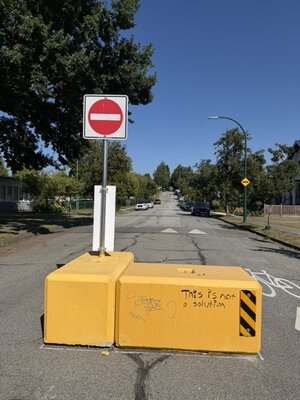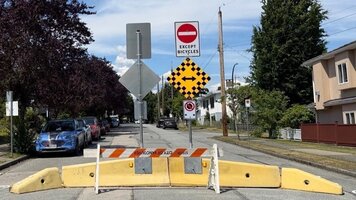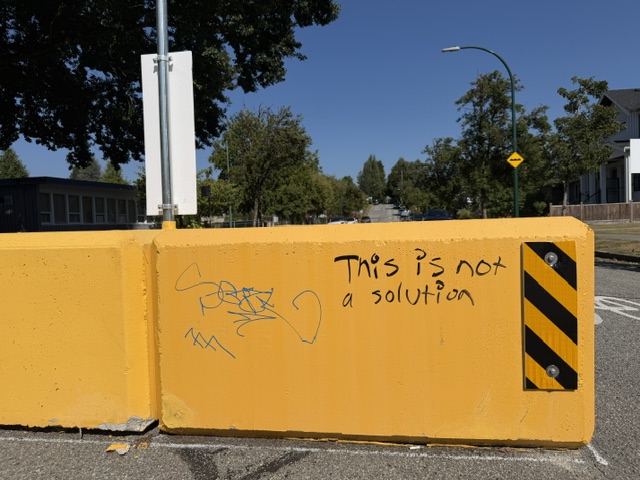
When residents raise concerns about emergency vehicles reaching their streets, the response is often that the concern is anecdotal. Understandable, perhaps. Nobody keeps a stopwatch when they call 911.
So this post does not rely on residents' accounts. It relies on the City of Vancouver's own budget document.
What the City wrote
In the City of Vancouver's 2017 Budget, published in December 2016, under the section covering Fire Suppression and Special Teams, the City states:
"VFRS is experiencing a slight increase in response times to fires due to increasing traffic congestion and traffic-calming initiatives. The percentage of fires confined to the area of origin has been decreasing over the last five years, partially due to increased response times."
That is the City describing its own fire service, in its own budget, naming traffic calming as one of the causes.
The numbers alongside it
The same page carries Vancouver Fire and Rescue Services' response times at the 90th percentile — meaning nine out of ten calls were reached within this time:
| Year | Response time (90th percentile) |
|---|---|
| 2012 | 6:08 |
| 2013 | 6:14 |
| 2014 | 6:25 |
| 2015 | 6:28 |
| 2016 (forecast) | 6:35 |
Twenty-seven seconds slower across five years. On its own, a modest number.
The line underneath it is the one worth sitting with. Over the same period, the percentage of structure fires confined to the area where they started fell from 24 per cent to 19 per cent. The City connects the two directly: fires are spreading further, partially because crews are arriving later.
It is not only fires
Further down the same page, under "Medical calls," the City writes that the medical response-time metric "is seeing an increase due to multiple factors, which include traffic congestion and traffic-calming initiatives."
So the City names traffic calming as a contributing factor for both fire and medical response.
What this does and does not prove
We want to be precise, because precision is the point.
This does not prove that traffic calming is the main cause of slower emergency response. The City says "slight increase," and lists traffic congestion alongside traffic calming. Other factors — call volume, staffing, dispatch, ambulance availability — affect response times too, and the City has said so elsewhere.
This is not East Vancouver data. These are citywide figures. The City has not published response-time data broken down by neighbourhood, or before-and-after figures for individual traffic-calming projects.
What it does establish is that the mechanism is real and the City knows it. When a resident says that barriers and closures could delay an emergency vehicle, they are not speculating. They are describing something the City identified in a budget document a decade ago.
The question that follows
If the City recognised in 2016 that traffic-calming initiatives were contributing to slower fire and medical response, then a reasonable person would expect that every traffic-calming project since has been assessed for its effect on emergency access, with that assessment published.
We have not been able to find those assessments for the projects in our area.
That is what we are asking for. Not a halt to everything. An answer to a straightforward question: when these streets were closed and diverted, what did the City conclude about emergency vehicle access, and who signed off?
Source
City of Vancouver, 2017 Budget, Part II: Department Service Plans, page 176. Published December 2016. Available on the City of Vancouver website.